


NEWSnews
Capacitive Current Tester: Structure, Wiring, Calculation & Results
六、How to Evaluate Key Structures and Parameters: An Example
What should you look at first when evaluating a device? Focus on the functional blocks, connection method, and verification capabilities—not a single impressive specification.
A device of this type can essentially be broken down into several functional blocks: an offset-frequency signal source, secondary-side signal acquisition and conditioning unit, measurement and computation unit, human-machine interface and display unit, data storage and communication interfaces, as well as the power supply and printing output components for field use. Understanding the role of each block is more important than simply memorizing a particular specification.
The offset-frequency signal source generates a test signal that deviates from the power frequency (50 Hz) and its integer harmonics, and injects it into the PT secondary-side open-delta circuit. The reason for using an “offset frequency” is that the area around the power frequency is filled with the system’s own voltage, current, and harmonic components. If the test signal also uses the power frequency, it becomes difficult to distinguish the “system’s own signals” from the injected test excitation in the acquired signal. By shifting the test frequency, the measurement unit can use frequency-selective processing to extract only the response of interest. This allows relatively clean measurement results to be obtained even in energized field environments with interference—this is the essence of the “anti-interference capability of the offset-frequency method.”
After measuring the response at the open-delta point, the acquisition and computation unit combines the known injected excitation, PT ratio, and other parameters to derive the system’s equivalent capacitance to ground, which is then converted into the three-phase-to-ground capacitive current. The display unit presents the results to the operator, while the storage and communication interfaces, such as serial communication, data storage, and printing, provide traceability and facilitate subsequent verification. Functions mentioned for the device in the figure, such as “electronic perpetual calendar clock display, data storage, printing, and serial communication,” essentially serve the data chain of “measurement, storage, and retrieval.”
When reviewing the specifications of this type of device, several points should be considered. First, the measurement range should cover the actual capacitive current level of the system under test, with sufficient margin. Second, accuracy specifications should be evaluated by range segment; typically, medium and low ranges provide higher accuracy, while wider ranges may have relatively wider tolerances. Third, pay attention to the supported connection methods and the conditions under which the PT open-delta connection is required. Fourth, evaluate its anti-interference algorithms, result verification, and report output capabilities. The following parameter table explains these points in detail.
七、Distribution Network Capacitive Current Tester: Specifications and Typical Performance Indicators
How should the specifications be read? The measurement range determines whether it can measure the target, accuracy determines how accurate the results are, connection method and anti-interference capability determine ease of use, while data storage and communication determine whether the results can be verified.
The following table uses the typical configuration of the device shown in the figure as an example and lists the key specifications of this type of instrument. All values in the table are typical configurations/example specifications; the actual technical documentation shall prevail.
Parameter Name | Typical Range or Example Specifications | Parameter Description | Impact on Measurement Results | Key Selection Considerations |
Three-Phase-to-Ground Capacitive Current Measurement Range | 1 A–500 A (Typical Example) | Range of Ground Capacitance Current Measurable by the Device | Insufficient Range May Cause Measurement Failure or Saturation Distortion in Systems with High Capacitive Current | The range should cover the actual current level of the system with sufficient margin; systems with a high proportion of underground cables should favor a wider measurement range. |
Three-Phase-to-Ground Capacitance Measurement Range | 1 μF–250 μF (Typical Example) | Derived System Equivalent Capacitance to Ground | Corresponds to the current measurement range and serves as an intermediate value for current conversion. | Check whether it matches the current measurement range and whether the conversion logic is clear. |
Measurement Error (by Range Segment) | ≤5% for some range segments; ≤10% for wider ranges (Typical Example) | Deviation Between the Measured Value and the True Value | Measurement error directly affects the reliability of compensation selection and evaluation criteria. | Check whether the error is specified by range segment and whether the commonly used range falls within the high-accuracy region. |
Test Method | PT Secondary-Side Open-Delta Offset-Frequency Induction Method | Measurement by injecting an offset-frequency signal through the low-voltage secondary side. | Determines whether testing can be performed without a power outage and how well the device resists interference. | Whether it is compatible with the site’s PT conditions and whether its offset-frequency anti-interference performance is reliable. |
Connection / Adaptation Method | Open-Delta, Transformer/Generator Neutral Point, and Other Variants | Connection Path Between the Device and the System | Mismatch in the connection method may result in measurement failure or inaccurate results. | Whether it matches the on-site PT and neutral-point access conditions. |
Operating Voltage Level | Low-Voltage Secondary-Side Operation | The operation is performed on the secondary side rather than the high-voltage side. | Related to field safety and the complexity of work organization. | Whether the test can actually be completed on the low-voltage side. |
Support for Live-Line Testing | Supported (Measurement Without Powering Down the Primary Side) | Whether Line Shutdown Is Required During Testing | Affects survey efficiency and outage costs. | For inspection and survey applications, priority should be given to support for testing without power outages. |
Anti-Interference Capability | Offset-Frequency Selection and Harmonic Suppression | Ability to Withstand Power-Frequency, Harmonic, and Field Interference | Strong interference directly affects measurement accuracy and repeatability. | Sites with complex harmonics and frequent switching require special attention. |
Data Storage and Communication | Data Storage, Serial Communication, and Printing | Result Traceability and Export Capability | Affects result verification, trend management, and report generation. | Whether it meets the requirements for records, verification, and report generation. |
Power Supply and Field Adaptability | Field Power Supply and Portable Design | Ease of Use in the Field | Affects the practicality of on-site inspection and survey work. | Portability, Battery Life, and Environmental Adaptability |
When reviewing the specifications, keep one core logic in mind: the measurement range determines “whether it can measure,” accuracy determines “whether the measurement is accurate,” the connection method and anti-interference capability determine “whether it is practical and reliable in the field,” while data storage and communication determine “whether the results can be verified later and used to generate reports.” None of these specification categories should be overlooked; any weakness can be amplified in actual operation.
八、Test Wiring, Measurement Circuit, and Field Operation Logic
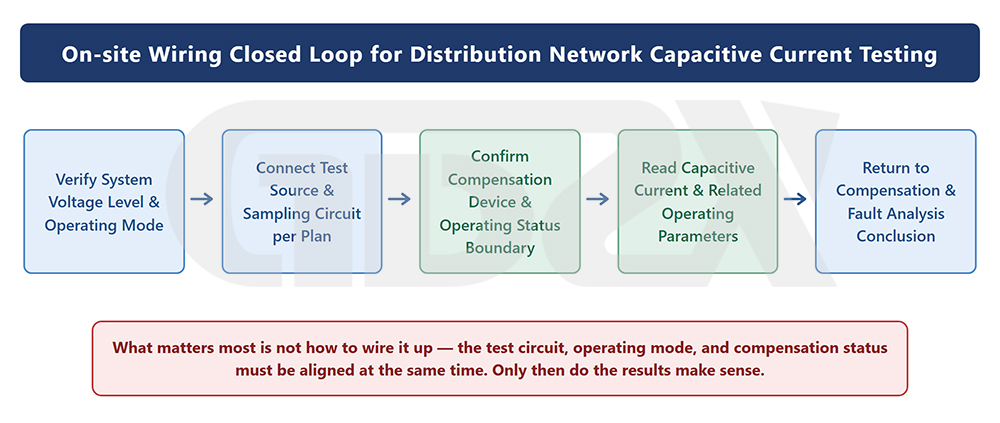
Figure: Field Wiring Loop for Distribution Network Capacitive Current Testing
How should the wiring be connected on site? First confirm the operating mode and PT conditions, then identify the injection and acquisition circuits of the open-delta winding, and finally perform the test in sequence with repeated measurements for verification.
In this section, we will walk the reader through the field test process and explain the wiring and sequence for the PT secondary-side open-delta method, so that the procedure can be understood even without a diagram.
What components make up the measurement circuit? A typical open-delta offset-frequency measurement circuit includes the secondary winding of the system voltage transformer (PT), particularly the open-delta (residual voltage) winding; the offset-frequency signal injection/acquisition terminals of the tester; test leads connecting the secondary circuit to the tester; and the tester’s internal signal source, acquisition, computation, and display units. The core concept is that the tester applies an offset-frequency signal to the PT secondary-side open-delta circuit while simultaneously acquiring the response of the circuit, and then determines the system’s capacitance to ground from the relationship between the response and the excitation.
Why can the primary-side capacitance to ground be reflected even though the measurement is performed on the low-voltage side? The key is that the PT maps the primary system’s phase-to-ground voltage to the secondary side according to its transformation ratio. The imbalance of the system’s three-phase-to-ground capacitance and the zero-sequence voltage appear as a residual-voltage response in the PT open-delta winding. The open-delta winding essentially reflects the zero-sequence component of the three-phase voltage, while the zero-sequence path is also the path through which capacitive current to ground flows. Therefore, by applying an offset-frequency excitation to the open-delta circuit on the secondary side and measuring its response, the equivalent capacitance to ground of the primary-side system can be indirectly calculated through the PT ratio and equivalent circuit relationships, and the capacitive current can then be derived. Performing the work on the low-voltage side simply moves the “observation point”; the object being measured remains the capacitance to ground of the entire system.
Relationship among the open-delta winding, secondary-side signal, and system equivalent capacitance to ground. This can be understood as follows: the system capacitance to ground is the physical quantity being measured; through the electromagnetic coupling between the PT primary and secondary sides, it leaves an observable electrical characteristic in the open-delta winding; the tester injects an offset-frequency signal into the open-delta circuit and acquires the response, then uses the known injected quantity and PT parameters to “solve for” the unknown capacitance to ground. The relationship among the three is therefore “measured quantity – mapping channel – observation and calculation.”
Conditions that should be confirmed before testing. Before starting the test on site, make sure to confirm the following: the current operating mode of the system, including which lines are in service and whether loop transfer or tie operation is involved; the PT configuration and transformation ratio, and whether the open-delta winding is brought out and available for use; the system neutral grounding method, such as ungrounded, grounding through an arc-suppression coil, or grounding through a small resistor; the operating status of the arc-suppression coil, since whether compensation is in service can significantly affect the measurement and must be handled or its influence excluded as required by the equipment; the energized condition of the lines and the required safety isolation measures; and whether the system parameters to be entered, such as rated voltage and PT ratio, are correct. If any of these prerequisites are incorrect, the subsequent measurement data may lose its validity.
Which wiring or field conditions are most likely to cause misjudgment? In practice, misjudgment is more likely under the following conditions: improper PT open-delta wiring, or incorrect polarity/phase sequence, resulting in abnormal response signals; frequent changes in system operating mode, causing the network configuration to change during measurement and making before-and-after data incomparable; strong harmonic interference on site, which can contaminate the measurement if anti-interference processing is inadequate; the arc-suppression coil being in service without its influence being correctly excluded, resulting in a measured value representing the compensated condition rather than the system’s inherent capacitive current; incorrect parameter entry, such as an incorrect PT ratio or rated voltage, causing a systematic deviation in the calculated result; and abnormalities in the secondary circuit itself, such as poor contact, winding faults, or improper grounding, which can distort the acquired signal.
Recommended field test sequence. The general procedure is: verify and record the system operating mode and grounding method → confirm that the PT open-delta winding is available and inspect the secondary circuit → connect the test leads according to the equipment instructions and verify polarity and terminals → correctly enter system parameters such as voltage level and PT ratio → handle or clearly identify the operating status of the arc-suppression coil → start the offset-frequency test and read the three-phase-to-ground capacitive current and capacitance to ground → repeat the measurement at least once to verify consistency → record, store, and export the results, and print them when necessary for traceability. The entire process emphasizes “confirm the prerequisites first, then perform the test, and verify the results afterward,” rather than simply connecting the leads and reading the displayed value.
九、Common Calculation Formulas, Compensation Logic, and Result Interpretation Methods
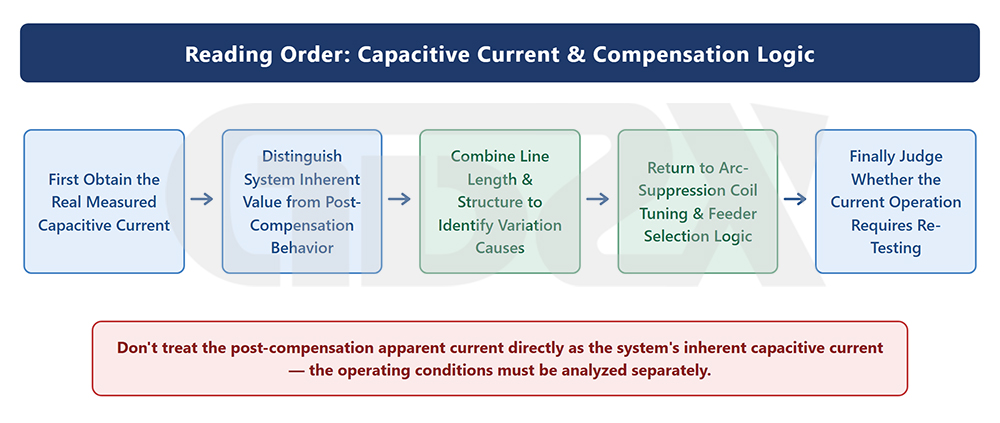
Figure: Interpretation Sequence for Capacitive Current and Compensation Logic
What is the underlying logic for interpretation? Put current, capacitance, frequency, and phase voltage into the same set of relationships, then make a comprehensive judgment based on the system context rather than focusing on a single value.
This section explains the relationships behind the measured values without turning into a purely theoretical discussion.
Core formula for capacitive current. The commonly used engineering expression is:
IC=3ωCUφI_C = 3\omega C U_\varphi
where $I_C$ is the single-phase-to-ground fault capacitive current, $\omega = 2\pi f$ is the angular frequency, $C$ is the system capacitance to ground per phase, and $U_\varphi$ is the system phase voltage. The coefficient 3 results from the increase in the phase-to-ground voltages of the two healthy phases during a single-phase-to-ground fault and the resulting summation of the three-phase capacitive currents to ground. If line voltage $U_l$ is used, since $U_\varphi = U_l/\sqrt{3}$, the equivalent expression can also be written as:
IC=3 ωCUlI_C = \sqrt{3}\,\omega C U_l
Calculating capacitance from current. Conversely, when the measured capacitive current is known, the system capacitance to ground can be calculated as:
C=IC3ωUφC = \frac{I_C}{3\omega U_\varphi}
The tester internally first measures the response related to the capacitance to ground, determines $C$, and then converts it into $I_C$ using the above formula. Understanding this relationship makes it clear why the “capacitance measurement range” and “current measurement range” are usually specified together.
Why can capacitive current differ greatly even in two 10 kV systems? Because $I_C$ is directly proportional to the system capacitance to ground $C$, while $C$ is determined by the network structure. Overhead lines generally have relatively low capacitance to ground per kilometer, whereas cables can have capacitance to ground dozens of times greater than that of overhead lines. The longer the lines, the more branches they have, and the higher the cable proportion, the larger $C$ becomes, and therefore the larger $I_C$ becomes. Thus, two systems with the same 10 kV voltage level may show very different results: a short feeder consisting mainly of overhead lines may have only a few amperes, while an urban distribution network with a high degree of cabling may have several tens of amperes. Such a difference is entirely normal. This is also the fundamental reason why “a general empirical value cannot replace actual measurement.”
Relationship between capacitive current and arc-suppression coil compensation. The purpose of an arc-suppression coil is to provide inductive current to compensate for the system’s capacitive ground current, thereby minimizing the residual current at the fault point and facilitating arc extinction. The relationship between compensating inductive current $I_L$ and capacitive current $I_C$ determines the operating condition: $I_L < I_C$ indicates undercompensation, with the residual current remaining predominantly capacitive and relatively large; $I_L > I_C$ indicates overcompensation, with the residual current becoming predominantly inductive; and $I_L \approx I_C$ indicates near-full compensation, where the residual current is minimized, but the system is close to resonance and therefore faces a risk of resonant overvoltage. In engineering practice, arc-suppression coils are generally operated in an overcompensated condition with an appropriate “detuning degree,” so that the residual current remains sufficiently small while resonance is avoided. The detuning degree, compensation capacity, and tap selection should all be calculated on the basis of the measured capacitive current. If the measurement is inaccurate, the resulting compensation selection and tuning assessment will also be inaccurate.
Why should you not look at only one current value? A single reading is merely a snapshot of one operating condition at one particular moment. Reliable interpretation also requires consideration of the system structure, such as the overhead-to-cable ratio and line length; the current operating mode, including whether loop transfer is involved; the operating status of the arc-suppression coil; historical measurement trends; and the consistency of at least one repeated measurement. If the current result differs significantly from historical values, first suspect a change in operating conditions or an error in wiring or parameter settings rather than immediately accepting the value as valid. Relevant engineering concepts may also include single-phase-to-ground residual current, meaning the current that still flows through the fault point after compensation; overcompensation and undercompensation; and the resonance risk near full compensation. These factors all indicate that capacitive current should be “put back into the overall system for comprehensive evaluation,” rather than treated as an isolated number.
The practical purpose of interpretation. Ultimately, the measured capacitive current should answer several engineering questions: whether an arc-suppression coil needs to be installed or adjusted; whether the compensation capacity and tap selection are appropriate; whether the detuning degree is reasonable; whether the grounding method remains suitable; and whether feeder selection and protection settings need to be updated. Judging whether a particular current value is “good” or “bad” without considering the specific grounding system and distribution network context is meaningless.
Practical Case: Why Capacitive Current Must Be Re-Measured After Line Expansion
Capacitive current should be re-measured as soon as possible after a distribution network is expanded, because newly added cables and branches directly change the system capacitance to ground. Consider a common scenario: a 10 kV distribution network originally consisted mainly of overhead lines, and its historical capacitive current records were relatively low. Later, several new cable feeders were added as an industrial park expanded, but the operating department continued to use the original compensation parameters. As a result, the residual current during a single-phase-to-ground fault increased, the arc-suppression coil’s detuning degree deviated from its original design range, and ground-fault handling became noticeably slower. After re-measurement, it was found that the problem was not an abnormality in the arc-suppression coil itself, but a change in the system’s equivalent capacitance. This type of case shows that the most practical value of a distribution network capacitive current tester is often not “initial data collection,” but rather “verification after structural changes.”
Common Misjudgment: Treating the Post-Compensation Current as the System’s Inherent Capacitive Current
Improper handling of measurements with the arc-suppression coil in service is one of the most common sources of misjudgment on site. When the measured value becomes smaller, some may directly conclude that the system’s capacitive current itself is small. In reality, this may simply be the apparent result after compensation. The correct logic is to first confirm the neutral grounding method and the operating status of the arc-suppression coil, and then determine, according to the measurement method requirements of the equipment, whether the compensation effect needs to be excluded. Otherwise, even with the same instrument and the same report format, completely different engineering conclusions may be reached.
Comparison Example: Why Do Overhead and Cable Feeders Produce Very Different Results at the Same 10 kV Level?
Even within the same 10 kV system, capacitive current can differ by several times or even more than ten times due to differences in line structure. At a site consisting mainly of short, fully overhead feeders, the measured value may be only a few amperes to less than 10 A. In urban distribution networks with a high cable ratio and numerous branches, capacitive current values of several tens of amperes are not uncommon. This comparison shows that capacitive current cannot be compared independently of network structure. It also demonstrates why measurement range and accuracy specifications should not be reduced simply according to an “average empirical value” when selecting and purchasing equipment.


